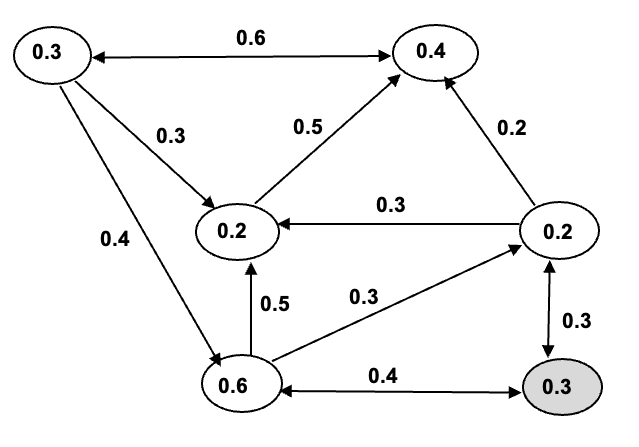
Influence Spread (1 point)
Show the influence spread in the following graph starting from highlighted node using Linear Threshold Model. Node values indicate the thresholds, and edge values indicate the weights. Mark the order of the spread.

Search in Graph (1 point)
Rank the nodes (neighbors of node 1) based on Local Betweenness Centrality (LCB) when we start searching from node 1.

Causal Loops (1 point)
Draw the causal loop diagram for SIR model (1 point).
Bonus
1. Implement code for Linear Threshold Model assuming it takes edge list and node list as input and outputs (iteration, activated nodes) pairs for each iteration. (Please make it user friendly) (1 point)
2. Implement code for LCB assuming it takes edge list/node list, and start node as input, and outputs ranking of neighboring nodes for start node. (Please make it user friendly) (1 point)
Submission of your homework is via WebCampus. You must submit all the required files in a single pdf document containing all the answers.